⚡ ~/naveed K8s Hub
⚡ Portfolio Home ✍️ Engineering Blog Deep Dives 🎯 Interview Hub 1,000+ Scenarios ☸️ Kubernetes Mastery Hub 24 Modules 🎮 DevOps Arcade & Quizzes Subnet Blitz ⚡ 🗺️ DevOps Roadmaps PDFs & Guides 🤖 Morpheus Analysis AI Quant ↗ 🛠️ Developer Tools Utilities 🧪 Labs & Experiments 📄 Interactive CV & Certs 🔗 All Links & Socials ⚡ Join The Dispatch (Weekly SRE Newsletter) →
// Production SRE Incident Response Runbook

Kubernetes Production Troubleshooting

From Symptom → Root Cause → Fix. In production, seeing a Kubernetes error is only the starting point. The real skill is knowing how to systematically identify the root cause without blindly restarting Pods.

💡

The Production Mindset: Don't Just Restart the Pod

Blindly restarting pods wipes ephemeral container state, resets crash counts, and masks critical concurrency bugs, memory leaks, and downstream connection leaks. Always diagnose why it failed, capture events and logs, apply the permanent architectural remediation, verify recovery, and configure automated preventive monitoring.

Diagnose ──► Investigate ──► Resolve ──► Prevent

Systematic 10-Step Troubleshooting Flow

Follow this battle-tested diagnostic ladder in sequence to isolate whether the failure is application logic, cluster control plane, DNS, or cloud infrastructure:

1
Pod Status
Inspect status column, restart counts, and container ready state across namespaces.
kubectl get pods -A -o wide
2
Events
Read scheduler rejections, Kubelet probe failures, image pull errors, and volume mount issues.
kubectl describe pod <pod>
3
Logs (Live & Previous)
Check stdout/stderr streams. Use --previous to capture logs right before the container terminated.
kubectl logs <pod> --previous
4
Service & Endpoints
Verify whether Service selectors match Pod labels and whether EndpointSlices contain healthy IPs.
kubectl get endpoints <svc>
5
Ingress / Load Balancer
Inspect Ingress controller logs, AWS ALB target group health checks, and path routing rules.
kubectl describe ingress <ing>
6
Node & Pod Resources
Profile CPU and Memory usage against configured requests and limits to spot saturation or leaks.
kubectl top pods && top nodes
7
Network & DNS
Execute DNS lookups from inside the Pod. Check CoreDNS health, /etc/resolv.conf, and NetworkPolicies.
kubectl exec <pod> -- nslookup <svc>
8
Identify Root Cause
Synthesize evidence: Is it application code/env, Kubelet runtime, or Cloud infrastructure?
kubectl get pod <pod> -o yaml
9
Declarative Fix
Patch manifests, fix Secrets/ConfigMaps, tune resource requests, or fix IAM/SecurityGroup bindings.
kubectl apply -f manifest.yaml
10
Verify & Monitor
Verify healthy pod transitions, check Prometheus metrics, and set alerts to prevent recurrence.
kubectl rollout status deploy/<name>

19 Production Kubernetes Errors: Diagnosis & Remediation

Search or filter by category to inspect exact symptoms, root causes, investigation steps, and diagnostic CLI commands:

🔍
🔁

CrashLoopBackOff

Container starts successfully but repeatedly exits or crashes
Workload & Pods

⚠️ What It Tells You

CrashLoopBackOff is a symptom, not a root cause. The container process starts, executes, and exits with a non-zero status code. Kubelet restarts it with an exponential back-off delay (10s, 20s, 40s up to 5m).

🔍 Common Root Causes

  • Missing or malformed environment variables, ConfigMaps, or Secrets.
  • Unhandled application panic, null pointer, or missing database migration.
  • Incorrect ENTRYPOINT or CMD arguments in container spec.
  • Failing liveness probe killing the container prematurely.
  • Exit code 137 (OOM killed) or 139 (segmentation fault).

⌨️ Diagnostic Commands & Remediation

kubectl logs <pod> --previous
kubectl describe pod <pod> | grep -A 10 "Last State"
kubectl get events --sort-by=.lastTimestamp

Fix: Check --previous logs for the stack trace. Verify ConfigMaps and Secrets referenced in envFrom exist. Ensure application dependencies (DB, Redis) are reachable before startup.
🖼️

ImagePullBackOff / ErrImagePull

Kubernetes worker node cannot retrieve the container image
Workload & Pods

⚠️ What It Tells You

The Kubelet CRI (containerd/CRI-O) failed to pull the requested image from the specified container registry, entering backoff retry.

🔍 Common Root Causes

  • Typo in image name, repository path, or tag (e.g. v1.0.0 vs 1.0.0).
  • Missing or expired imagePullSecrets credentials for private registry.
  • Node IAM role missing ECR read permissions (ecr:GetDownloadUrlForLayer).
  • Docker Hub rate limiting (HTTP 429 Too Many Requests).
  • VPC NAT Gateway or firewall blocking outbound node internet egress.

⌨️ Diagnostic Commands & Remediation

kubectl describe pod <pod> | tail -20
kubectl get secrets | grep docker
kubectl get pod <pod> -o jsonpath='{.spec.containers[*].image}'

Fix: Verify image exists in registry. Ensure spec.imagePullSecrets is configured for private images. Check AWS ECR token lifecycle or node security groups.

⏳

Pending

Pod created in API server but cannot be scheduled onto any worker node
Cluster & Node

⚠️ What It Tells You

The Kubernetes kube-scheduler evaluated all nodes in the cluster and found 0 nodes matching the Pod's placement constraints.

🔍 Common Root Causes

  • Insufficient CPU or Memory allocatable on any node to satisfy resources.requests.
  • Node taints present without matching tolerations in the Pod spec.
  • nodeSelector or nodeAffinity rules do not match any active node labels.
  • PersistentVolumeClaim (PVC) is unbound or waiting for volume provisioner.
  • Worker nodes are cordoned, drained, or at maximum pod capacity (maxPods).

⌨️ Diagnostic Commands & Remediation

kubectl describe pod <pod> | grep -A 10 Events
kubectl describe nodes | grep -A 8 "Allocated resources"
kubectl get pvc -A

Fix: Lower Pod resource requests if over-provisioned. Trigger Cluster Autoscaler / Karpenter to provision new nodes. Bind unbound PVCs or verify CSI storage classes.

🛑

OOMKilled (Exit Code 137)

Container exceeded memory limit and was terminated by Linux kernel
Workload & Pods

⚠️ What It Tells You

The container exceeded its configured resources.limits.memory. The Linux kernel cgroup OOM killer sent a SIGKILL signal (Exit 137 = 128 + 9).

🔍 Common Root Causes

  • Memory limits set too low for actual production concurrency.
  • Application memory leak (unbounded caches, unclosed connections).
  • Java JVM heap unconstrained (missing -XX:MaxRAMPercentage=75.0).
  • Large batch in-memory file or dataset processing.
  • Node-level memory pressure triggering Kubelet system eviction.

⌨️ Diagnostic Commands & Remediation

kubectl describe pod <pod> | grep -E "(OOMKilled|Exit Code)"
kubectl top pod <pod> --containers
kubectl top nodes

Fix: Increase memory limit headroom. Profile application heap with language profilers. Enforce TTL on memory caches. Configure Horizontal Pod Autoscaler (HPA) to spread load across replicas.

🔌

Service Not Reachable

ClusterIP or Service DNS is unreachable; traffic drops or returns connection refused
Networking & Ingress

⚠️ What It Tells You

Traffic is failing to route from the Service ClusterIP to backend Pods. kube-proxy or CNI has no valid endpoints to forward packets.

🔍 Common Root Causes

  • Service spec.selector does not match Pod metadata.labels.
  • Service targetPort does not match the container's listening port.
  • Pods are failing readiness probes, causing the Endpoints controller to drop them.
  • NetworkPolicy blocking ingress traffic between client and backend pods.
  • Application is binding to 127.0.0.1 instead of 0.0.0.0 inside container.

⌨️ Diagnostic Commands & Remediation

kubectl get endpoints,endpointslices <svc>
kubectl describe svc <svc>
kubectl get pods --show-labels -l <selector-key=val>

Fix: Align Service selectors and Pod labels. Ensure application listens on 0.0.0.0. Verify readiness probes pass so Endpoints register. Review NetworkPolicies.

⚠️

503 Service Unavailable

Ingress, ALB, or Reverse Proxy returns HTTP 503 error
Networking & Ingress

⚠️ What It Tells You

The load balancer or Ingress controller received the client request, but has zero healthy backend Pods available to process it.

🔍 Common Root Causes

  • All backend Pods are failing readiness probes simultaneously.
  • Deployment rollout failed, terminating old pods before new ones became ready.
  • AWS ALB Target Group health check path returns non-200 status.
  • Ingress controller cannot reach pod IPs due to CNI subnet routing failure.

⌨️ Diagnostic Commands & Remediation

kubectl get endpoints <svc>
kubectl describe ingress <ing>
kubectl logs -n ingress-nginx -l app.kubernetes.io/name=ingress-nginx

Fix: Fix failing readiness probes. Ensure TargetGroup health check path matches application route (e.g. /healthz). Use maxUnavailable: 0 during rolling deployments.

⏱️

504 Gateway Timeout

Gateway/Ingress did not receive a response from upstream within configured timeout
Networking & Ingress

⚠️ What It Tells You

The Ingress controller forwarded the connection to a backend Pod, but the Pod failed to complete and return the HTTP response before the timeout elapsed.

🔍 Common Root Causes

  • Backend application deadlock or thread exhaustion under heavy load.
  • Slow, un-indexed database queries or locked tables.
  • Downstream microservice or third-party API timeout.
  • Ingress proxy-read-timeout set too low for legitimate long-running requests.

⌨️ Diagnostic Commands & Remediation

kubectl logs <pod> --tail=100
kubectl top pods -l app=<name>
kubectl exec <pod> -- netstat -an | grep ESTABLISHED | wc -l

Fix: Add database indexes and optimize queries. Increase connection pools. Tune nginx.ingress.kubernetes.io/proxy-read-timeout: "120". Scale out backend replicas with HPA.

🌐

DNS Resolution Failures (CoreDNS)

Pods cannot resolve Service names or external internet domains
Networking & Ingress

⚠️ What It Tells You

DNS lookup queries sent to the cluster DNS service IP (10.96.0.10 or equivalent) return NXDOMAIN, timeout, or connection refused.

🔍 Common Root Causes

  • CoreDNS pods crashing, OOMKilled, or unscheduled due to node taint.
  • Linux kernel conntrack table overflow dropping UDP DNS packets.
  • ndots:5 in /etc/resolv.conf causing 5 sequential search domain lookups per query.
  • NetworkPolicy blocking egress traffic to port 53 in kube-system.
  • Upstream DNS loop in CoreDNS ConfigMap.

⌨️ Diagnostic Commands & Remediation

kubectl exec -it <pod> -- nslookup kubernetes.default
kubectl logs -n kube-system -l k8s-app=kube-dns
kubectl get endpoints -n kube-system kube-dns

Fix: Deploy NodeLocal DNSCache DaemonSet to prevent conntrack UDP packet loss. Scale CoreDNS replicas. Verify CoreDNS ConfigMap upstream forwarders.

⚡

High CPU Usage & CFS Throttling

Container CPU saturates or application suffers severe CFS quota latency spikes
Workload & Pods

⚠️ What It Tells You

Container or Node CPU reaches 100%, or container process is aggressively throttled by the Linux kernel Completely Fair Scheduler (CFS quota).

🔍 Common Root Causes

  • Un-optimized recursive application routines or busy-wait spinlocks.
  • Strict resources.limits.cpu throttling multi-threaded processes (e.g. Node/Java/Go).
  • Sudden traffic spike without corresponding horizontal replica scaling.
  • Noisy neighbor container saturating CPU cores on shared worker node.

⌨️ Diagnostic Commands & Remediation

kubectl top pods -A --sort-by=cpu
kubectl top nodes
kubectl describe pod <pod> | grep -A 5 Limits

Fix: Remove or raise CPU limits (best practice: set CPU requests for scheduling and let burst consume unused cycles). Configure HPA on CPU target (e.g. 70%).

📈

High Memory Usage & Leaks

Memory consumption grows monotonically towards limit without freeing
Workload & Pods

⚠️ What It Tells You

Container memory working set steadily climbs. Garbage collection cycles fail to reclaim memory, putting the pod at immediate risk of OOM termination.

🔍 Common Root Causes

  • Application memory leak (unclosed event listeners, unreleased byte buffers).
  • In-memory cache without maximum entry limits or expiration TTL.
  • Unbounded worker queues holding unprocessed event payloads in RAM.

⌨️ Diagnostic Commands & Remediation

kubectl top pods -A --sort-by=memory
kubectl top pod <pod> --containers

Fix: Capture heap profile before pod restarts (e.g. Go pprof, Java jmap). Enforce cache size limits. Set appropriate requests and limits.

⏳

Pod Not Ready (Workload Warmup & Init)

Pod status is Running, but READY column shows 0/1 or 1/2
Probes & Lifecycle

⚠️ What It Tells You

The container process has started, but it has not signaled readiness to receive production traffic. It is excluded from Service Endpoints.

🔍 Common Root Causes

  • Slow application initialization (compiling JIT, loading large ML models or caches).
  • Init container is still running or blocked waiting for a service.
  • Readiness probe initialDelaySeconds too short.

⌨️ Diagnostic Commands & Remediation

kubectl describe pod <pod> | grep -A 8 Conditions
kubectl logs <pod> -c <init-container-name>

Fix: Implement a startupProbe with generous failureThreshold to allow slow apps time to initialize without triggering readiness failure.

🩺

Pod Not Ready (Probe Failure)

Readiness probe returned non-200 code; Kubelet removes pod from Service endpoints
Probes & Lifecycle

⚠️ What It Tells You

Kubelet periodically polls the readiness endpoint (HTTP, TCP, or exec). The check failed failureThreshold times in a row.

🔍 Common Root Causes

  • Health check endpoint /healthz or /ready returns HTTP 500.
  • Application deadlocked on database connection pool or downstream API.
  • Readiness probe port does not match application port.

⌨️ Diagnostic Commands & Remediation

kubectl describe pod <pod> | grep -A 5 Readiness
kubectl exec <pod> -- curl -i localhost:<port>/healthz

Fix: Ensure readiness probes check local health, not external dependencies (prevent cascading cluster outages). Adjust probe timeout and period.

💔

Liveness Probe Failed

Kubelet kills and restarts container because liveness check repeatedly timed out or failed
Probes & Lifecycle

⚠️ What It Tells You

Liveness probes verify if the container is deadlocked and needs a restart. When failed, Kubelet terminates the process and restarts it, incrementing restart count.

🔍 Common Root Causes

  • Liveness probe checking external DB (Anti-Pattern: DB hiccup restarts every app pod).
  • Probe timeoutSeconds: 1 too aggressive during garbage collection pauses.
  • Application thread pool locked in permanent deadlock.

⌨️ Diagnostic Commands & Remediation

kubectl describe pod <pod> | grep -A 6 Liveness
kubectl logs <pod> --previous | tail -30

Fix: Decouple liveness probes from external services. Increase timeoutSeconds (e.g. 5s) and failureThreshold: 3. Profile threads before restart.

🔍

Readiness Probe Failed

Application running but not ready to serve live customer requests
Probes & Lifecycle

⚠️ What It Tells You

The container is healthy enough not to be killed by liveness, but cannot accept user traffic. Traffic is temporarily redirected to other ready replicas.

🔍 Common Root Causes

  • Database migrations running during deployment.
  • Redis or message broker disconnected.
  • Readiness path or port mismatch in YAML manifest.

⌨️ Diagnostic Commands & Remediation

kubectl describe pod <pod> | grep "Readiness probe failed"
kubectl exec <pod> -- curl -v localhost:<port>/ready

Fix: Fix downstream connectivity or wait for schema migration to finish. Test probe URL directly from inside the pod.

🚫

FailedScheduling

Scheduler cannot find any compatible node in the cluster
Cluster & Node

⚠️ What It Tells You

Events show 0/N nodes available with reasons like: node(s) had untolerated taint, insufficient cpu, or node affinity failed.

🔍 Common Root Causes

  • Cluster capacity exhausted; all nodes lack allocatable CPU or RAM for the request.
  • Node taint (e.g. gpu=true:NoSchedule) missing matching toleration.
  • Strict anti-affinity rules preventing pod co-location on remaining nodes.

⌨️ Diagnostic Commands & Remediation

kubectl describe pod <pod> | grep FailedScheduling
kubectl get nodes -o custom-columns=NAME:.metadata.name,TAINTS:.spec.taints

Fix: Add required tolerations to pod spec. Scale cluster nodes or enable Karpenter. Relax strict pod anti-affinity to preferred affinity.

💾

FailedMount / FailedAttachVolume

PersistentVolume cannot be attached or mounted into pod file system
Storage & PVC

⚠️ What It Tells You

Cloud volume controller or node Kubelet failed to attach or format the requested disk volume (EBS, Persistent Disk, NFS).

🔍 Common Root Causes

  • Multi-Attach error for volume: ReadWriteOnce EBS volume still attached to old node.
  • Availability Zone mismatch: Pod scheduled in us-east-1a, EBS volume is in us-east-1b.
  • CSI driver daemonset crashed or missing AWS IAM permissions.
  • Secret or ConfigMap projected volume key does not exist.

⌨️ Diagnostic Commands & Remediation

kubectl describe pod <pod> | grep -A 8 "FailedAttachVolume"
kubectl get pvc,pv
kubectl get storageclass

Fix: Use volumeBindingMode: WaitForFirstConsumer in StorageClass so volumes are created in the same AZ as the scheduled Pod. Delete hung pod to release volume lock.

🖥️

Node NotReady

Worker node stops reporting heartbeats; control plane marks node NotReady
Cluster & Node

⚠️ What It Tells You

The control plane hasn't received a node lease/heartbeat within node-monitor-grace-period (40s default). Pods will be evicted after eviction timeout.

🔍 Common Root Causes

  • Kubelet service stopped or crashed (OOM, systemd failure).
  • Container runtime (containerd/CRI-O) frozen or socket unresponsive.
  • DiskPressure, MemoryPressure, or PIDPressure threshold breached.
  • Underlying cloud VM hardware failure or AWS instance retirement.

⌨️ Diagnostic Commands & Remediation

kubectl describe node <node> | grep -A 10 Conditions
ssh <node> 'sudo systemctl status kubelet containerd'
ssh <node> 'journalctl -u kubelet -n 50 --no-pager'

Fix: SSH to node, check disk space (df -h), prune dead container images (crictl rmi --prune), and restart Kubelet & containerd.

📦

ContainerCreating Stuck

Pod scheduled to node but remains in ContainerCreating indefinitely
Workload & Pods

⚠️ What It Tells You

Kubelet received the Pod assignment from the scheduler, but is blocked trying to fulfill prerequisites before starting the container runtime.

🔍 Common Root Causes

  • Secret or ConfigMap referenced in envFrom or volume mount does not exist.
  • PVC volume attachment is waiting on AWS EBS detachment from another node.
  • CNI IP address exhaustion (AWS VPC CNI has no free secondary IPs in subnet).

⌨️ Diagnostic Commands & Remediation

kubectl describe pod <pod> | tail -15
kubectl get events --field-selector involvedObject.name=<pod>

Fix: Read the Events block. Create the missing Secret/ConfigMap or expand subnet CIDR / CNI warm IP target if IPs are exhausted.

⚠️

Evicted

Kubelet terminated pod to reclaim node disk or memory under resource pressure
Cluster & Node

⚠️ What It Tells You

Node available memory or disk space breached hard eviction thresholds (e.g. nodefs.available < 10% or imagefs.available < 15%). Kubelet evicted lowest QoS pods.

🔍 Common Root Causes

  • Unconstrained container log files filling node root partition.
  • Pod writing gigabytes of scratch files to root disk without ephemeral-storage limits.
  • Node memory saturation causing system-level eviction before OOM killer.

⌨️ Diagnostic Commands & Remediation

kubectl describe pod <pod> | grep -E "(The node was low on resource|Evicted)"
kubectl delete pod --field-selector status.phase=Failed -A

Fix: Configure container log rotation (max-size: 10m). Specify ephemeral-storage limits in pod specs. Expand node EBS root volumes.

Top 10 Kubernetes Production Diagnostic Commands

The 10 most frequently executed CLI commands during live cluster triage, with real-world flags and usage tips:

1
kubectl get pods -A -o wide
Inspect pod status, restart counts, age, assigned node, and IP across all namespaces instantly.
2
kubectl describe pod <pod>
Inspect container exit codes, termination reasons, mount failures, and recent Kubelet Warning events.
3
kubectl logs <pod> --previous
Retrieve the stdout/stderr stream from the previous crashed container instance before restart.
4
kubectl get events -A --sort-by=.lastTimestamp
Display chronological timeline of cluster warnings, scheduler decisions, and probe failures.
5
kubectl get endpoints,endpointslices <svc>
Verify if the Service has healthy backend pod IPs registered to receive user requests.
6
kubectl top pods -A --sort-by=memory
Profile actual live RAM consumption across all pods to catch memory leaks before OOMKilled hits.
7
kubectl top nodes
Identify node CPU/Memory pressure, unbalanced pod scheduling, and impending node evictions.
8
kubectl exec -it <pod> -- nslookup <svc>
Test CoreDNS name resolution and latency directly from within the application pod namespace.
9
kubectl debug -it <pod> --image=busybox
Attach an ephemeral debug container with full diagnostic tools to minimal/distroless production pods.
10
kubectl describe ingress <ingress-name>
Inspect Ingress annotations, backend Service mappings, TLS certificate status, and ALB health.

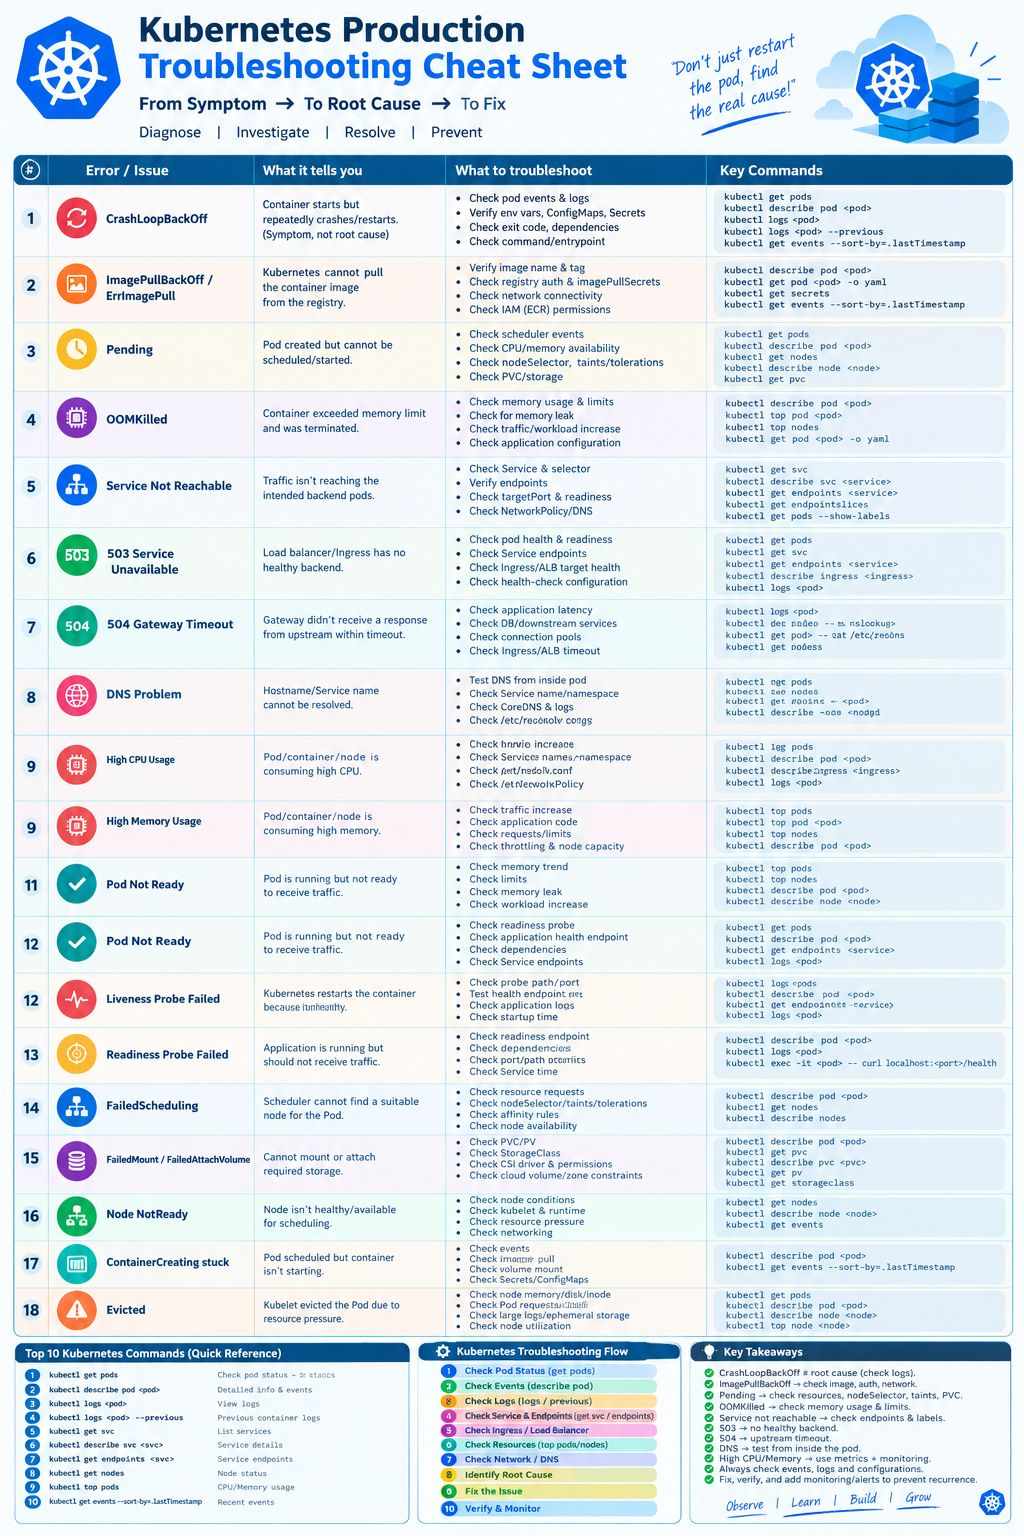
High-Resolution Cheat Sheet & Field Guide

Print or download the complete visual cheat sheet for team post-mortems, incident war rooms, and CKA/CKS exam preparation:

Kubernetes Production Troubleshooting Cheat Sheet — From Symptom to Root Cause to Fix
🔍 Click to Expand High-Res Infographic

Printable Production Diagnostic Poster

Designed for DevOps and SRE teams to eliminate guesswork during high-pressure outages. Summarizes the 19 core Kubernetes error states, investigation vectors, key diagnostic commands, systematic 10-step flow, and the "Don't just restart the pod" philosophy.

⬇ Download High-Res PNG (2.0 MB)
Format: 2400x3600px Ultra HD · Optimized for A3/A4 Posters & Slack sharing

Kubernetes Troubleshooting FAQ

Common questions asked by DevOps engineers and platform candidates during incident debriefs and CKA interviews:

Why is blindly restarting a failing Kubernetes Pod considered an anti-pattern? ▾

Restarting a pod destroys ephemeral state, flushes in-flight logs, and masks the underlying root cause such as memory leaks, thread deadlocks, or database connection pool exhaustion. It temporarily alleviates the symptom while allowing the outage to recur unpredictably under peak production traffic. Always capture describe events and --previous logs first.

What is the difference between CrashLoopBackOff and OOMKilled in Kubernetes? ▾

CrashLoopBackOff is a high-level status indicating that the container continuously starts and terminates with a non-zero exit code. OOMKilled (Exit Code 137) is a specific root cause where the Linux kernel OOM killer terminates the container for exceeding its configured memory limits (cgroups enforcement). An OOMKilled container frequently ends up in CrashLoopBackOff.

How do you inspect previous container logs after a crash in Kubernetes? ▾

Run kubectl logs <pod-name> -c <container-name> --previous. This retrieves the stdout/stderr stream from the terminated container instance before Kubelet restarted it, allowing you to see the unhandled exception, fatal crash, or panic.

Why does a Service return 503 Service Unavailable when Pods are in Running status? ▾

A Pod can be in "Running" status according to Kubelet while its readiness probe is failing. The Kubernetes endpoint controller only registers Pods with "Ready: true" into Service Endpoints and EndpointSlices. If 0 pods pass readiness probes, the Service has zero active backends, causing the Ingress or Load Balancer to return HTTP 503.

How do you debug a distroless or minimal container image that lacks a shell? ▾

Use Kubernetes ephemeral debug containers via kubectl debug -it <pod-name> --image=busybox --target=<container-name>. This attaches an ephemeral container sharing the target container's process namespace (PID namespace) and network interface, allowing you to inspect running processes and sockets without rebuilding the production container.